- Published on
Tạo biểu đồ thanh về lí do học tập của người học
- Authors

- Name
- Hai Nguyen
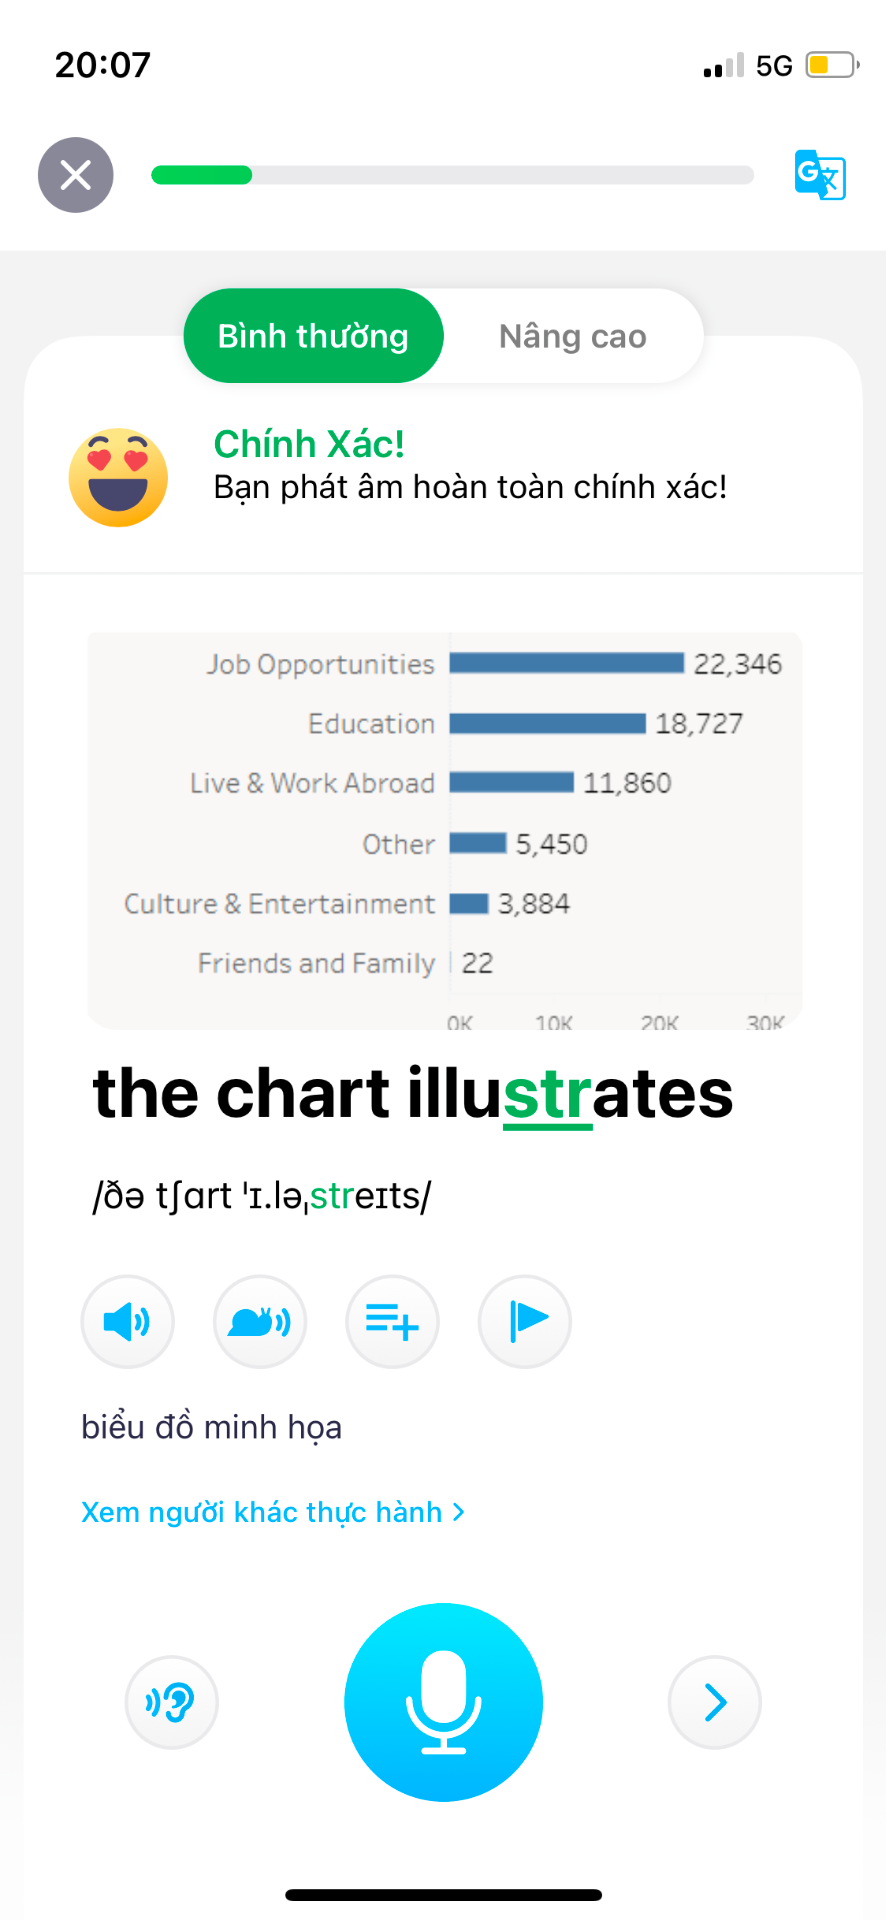
Trong khi luyện tập tiếng Anh trên app Elsa, tôi hay chụp hình lại những thứ mình thấy thu hút. Với bài này là bức hình:

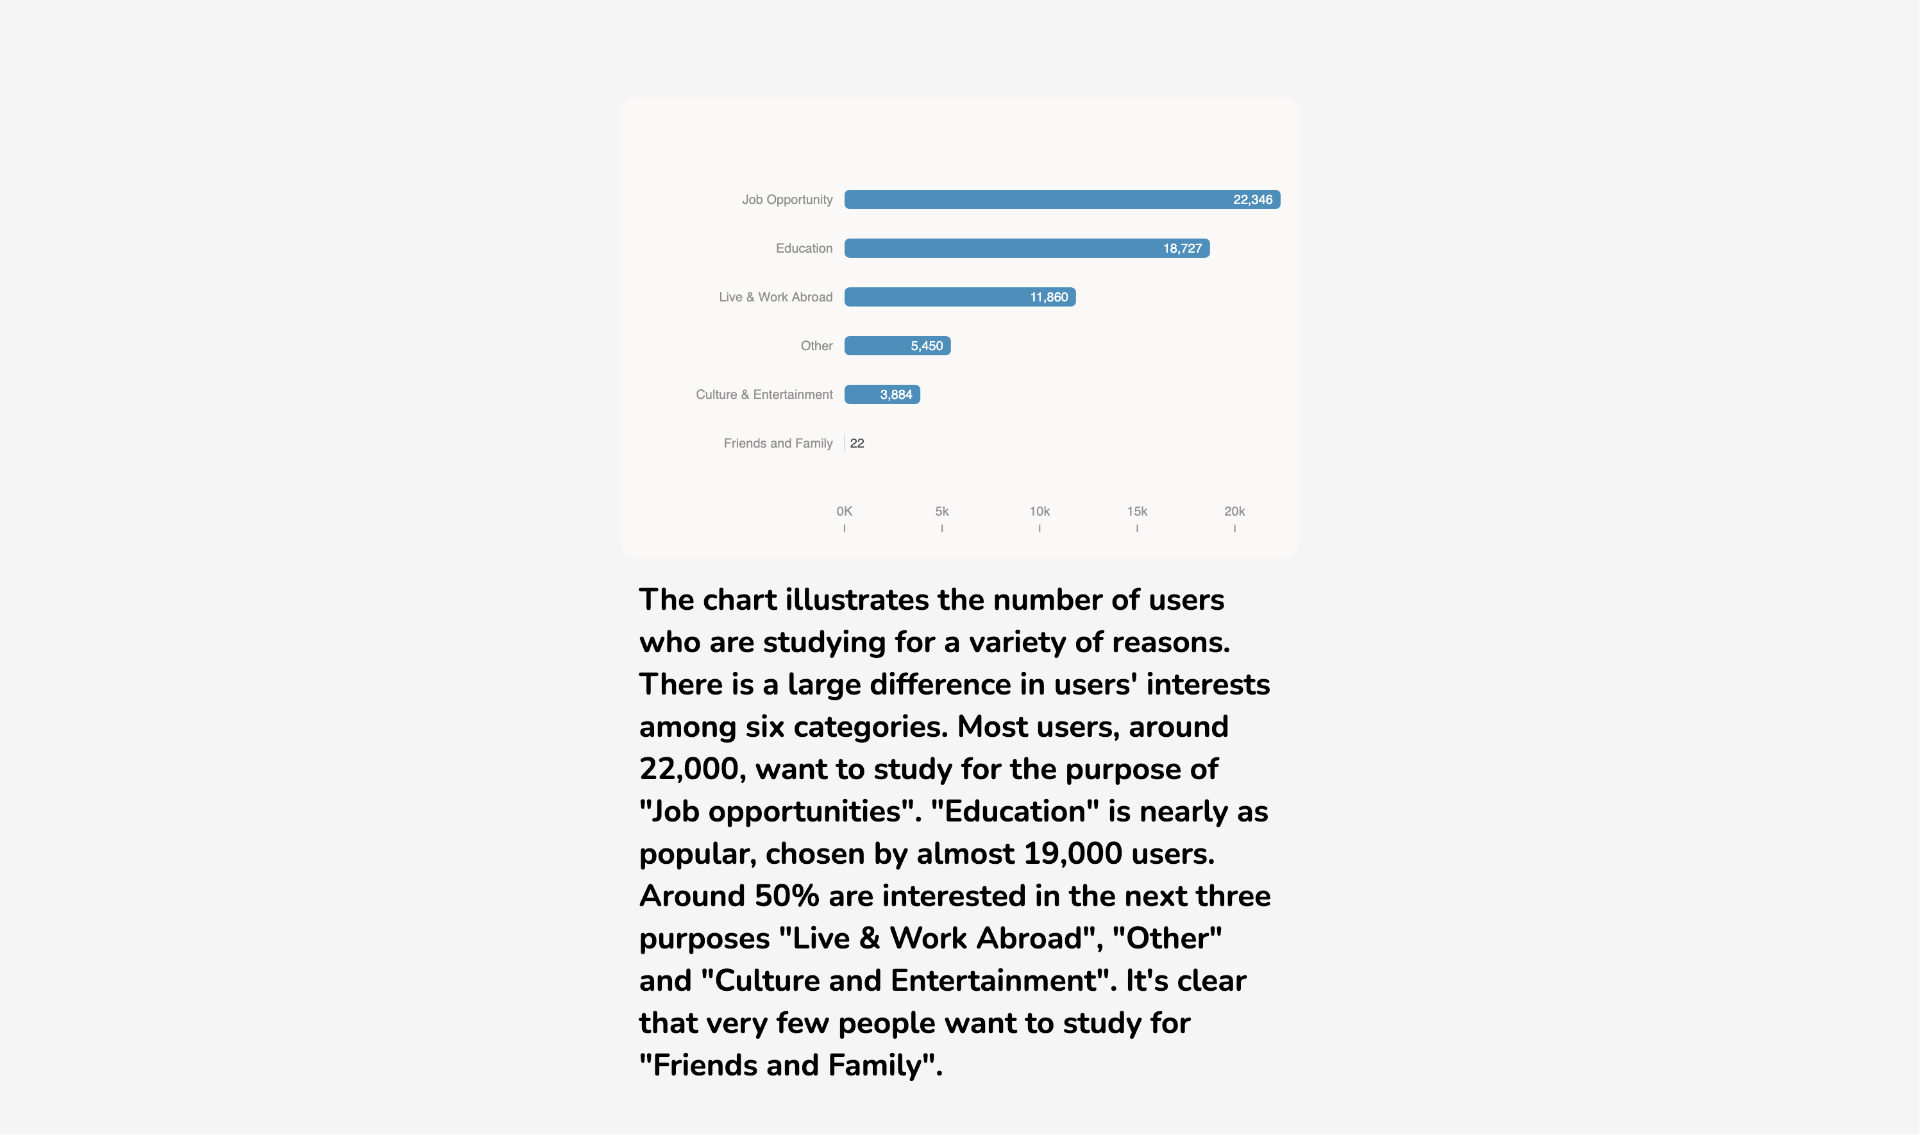
Biểu đồ trên minh hoạ số lượng người dùng theo nguyên do học tiếng Anh. Các nguyên do đó là: Job Opportunities, Education, v..v...
Dựa vào đây, tôi sẽ tạo giao diện biểu đồ thanh dựa vào thư viện d3
Javascript được sử dụng có kiểu module:
<body>
  <div id="container">
    <div id="chart"></div>
    <div id="content"></div>
  </div>
  <script type="module" src="main2.mjs"></script>
</body>
Ta có json data:
[
  { "letter": "Job Opportunity", "frequency": 22346 },
  { "letter": "Education", "frequency": 18727 },
  { "letter": "Live & Work Abroad", "frequency": 11860 },
  { "letter": "Other", "frequency": 5450 },
  { "letter": "Culture & Entertainment", "frequency": 3884 },
  { "letter": "Friends and Family", "frequency": 22 }
]
Phần đầu code Js ta sẽ import thư viện d3 và json data:
import * as d3 from 'https://cdn.jsdelivr.net/npm/d3@7/+esm'
import alphabet from './data.json' with { type: 'json' }
Kế đó qui định kích thước của biểu đồ:
const barHeight = 42
const marginTop = 30
const marginRight = 0
const marginBottom = 40
const marginLeft = 160
const width = Math.min(500, window.innerWidth - 64)
const radius = 0
const height = Math.ceil((alphabet.length + 0.1) * barHeight) + marginTop + marginBottom
Và tạo các thành phần của biểu đồ gồm trục ngang dọc, các thanh, số ứng với mỗi thanh:
// Qui định trục ngang dọc
const x = d3
  .scaleLinear()
  .domain([0, d3.max(data, (d) => d.frequency)])
  .range([marginLeft, width - marginRight])

const y = d3
  .scaleBand()
  .domain(d3.sort(data, (d) => -d.frequency).map((d) => d.letter))
  .rangeRound([marginTop, height - marginBottom])
  .padding(0.6)

const svg = d3
  .create('svg')
  .attr('width', width)
  .attr('height', height)
  .attr('viewBox', [0, 0, width, height])
  .attr(
    'style',
    `
        max-width: 100%;
        height: auto;
        font: 10px sans-serif;
        background-color: #faf6f6;
        padding: 16px;
        border-radius: 16px;
        margin-top: 16px;
        `
  )

// Tạo các thanh màu xanh
svg
  .append('g')
  .attr('fill', '#3f7aab')
  .selectAll()
  .data(data)
  .join('rect')
  .attr('x', x(0))
  .attr('y', (d) => y(d.letter))
  .attr('width', (d) => x(d.frequency) - x(0))
  .attr('height', y.bandwidth())
  .attr('rx', radius)

// Hiển thị con số của mỗi thanh
const format = x.tickFormat(20 /* , "%" */)
svg
  .append('g')
  .attr('fill', '#fff')
  .attr('text-anchor', 'end')
  .selectAll()
  .data(data)
  .join('text')
  .attr('x', (d) => x(d.frequency))
  .attr('y', (d) => y(d.letter) + y.bandwidth() / 2)
  .attr('dx', -6)
  .attr('dy', '0.35em')
  .text((d) => format(d.frequency))
  // condition: nếu giá trị nhỏ đẩy nó sang phải bằng dx và text-anchor
  .call((text) =>
    text
      .filter((d) => x(d.frequency) - x(0) < 20) // short bars
      .attr('dx', +4)
      .attr('fill', '#3c3c43')
      .attr('text-anchor', 'start')
  )

// Thêm trục x vào svg
const formatXTick = (d) => (d === 0 ? '0K' : d3.format('~s')(d))
svg
  .append('g')
  .attr('transform', `translate(0,${height - marginBottom + 30})`)
  .call(
    d3
      .axisBottom(x)
      .ticks(width / 80)
      .tickFormat(formatXTick)
  )
  .call((g) => g.selectAll('.tick text').attr('dy', -16).attr('fill', '#7e7c84'))
  .call((g) => g.selectAll('.tick line').attr('stroke', '#7e7c84'))
  .call((g) => g.select('.domain').remove())

// Thêm trục y vào svg
svg
  .append('g')
  .attr('transform', `translate(${marginLeft},0)`)
  .call(d3.axisLeft(y).tickSizeOuter(0))
  .call((g) => g.select('.domain').remove())
  .call((g) => g.selectAll('.tick line').attr('stroke', 'none'))
  .call((g) => g.selectAll('.tick text').attr('fill', '#7c7c7c'))

chart.append(svg.node())
Trong bài cũng đề cập tới 2 khái niệm CSS là Cascade Layer thông qua keyword @layer và @container. Trong đó ta qui định thẻ #container` là một container:
#container {
  container-type: inline-size;
}
Tuy nhiên chúng được nhắc tới chỉ mang tính chất giới thiệu. Trọng tâm là biểu đồ thanh.
Cuộn xuống để tải bình luận
